
Author: Marcus Crowley, Head of Product, Place Score
How objective are we when we rate the places we live in? This article investigates the correlation between community values and place performance. Our findings are that our objectivity varies according to our own circumstances and which aspect of liveability we’re focused on. Australians can be generous in our assessment of social cohesion, objective when it comes to public amenity, and critical when it comes to safety and finding a car park.
The problem is you
Perhaps it’s my son becoming a man. Perhaps it’s the rat that has taken up residence in my back garden. Perhaps it’s the way the world is. Over the holidays, I reverted to pondering the bigger questions that might justify the scurrying that we humans do.
- Are we alone?
- How do we make the world better?
- What part can I play?
In the 2008 movie, The Day the Earth Stood Still, Klaatu – the alien played by Keanu Reeves – said:
➣ Your problem is not technology. The problem is you. You lack the will to change.
His interlocutor, Professor Barnhardt, played by John Cleese, said:
➣ But it’s only on the brink that people find the will to change. Only at the precipice do we evolve. This is our moment.
The alternative to lurching from one crisis to the next is learning as we go and taking incremental evidence-based action.
The price of fish in Sydney
At Place Score, we have reams of liveability data spanning the last seven years. We know what Australians like and dislike, and we use this data to help our clients make smart decisions about what to build and how to best serve the community.
Choosing what to build and then ensuring that those public projects are a success is often a struggle. Why is that?
Well for one, they’re wonderfully complex. Secondly, public space projects involve thousands of actors – although sadly, generally, not Mr Reeves or Mr Cleese – and we’re all different: you and I are going to disagree about implementation details. Think about the recently opened AU$ 836 million Sydney Fish Market, for example. You might prioritise a larger car park capacity, while I might prioritise a shorter construction timeline. We have different values.
I don’t want to live in a place where we all have the same values. Firstly, outside Pyongyang, it’s been impractical since the Middle Ages, and secondly, it’s part of what makes other people interesting. So, what we need is a framework for understanding and respecting different points of view and plotting a sensible course towards a common good.
In pursuit of this goal, at Place Score, we ask people – through surveys – to tell us which liveability attributes are important to them in their ideal neighbourhood. Then we ask them to rate those same attributes as they pertain to the area they live in. This enables our clients to prioritise the different liveability attributes in projects they are planning. We provide an evidence base – using 50 distinct liveability attributes – for governments to gradually improve public places.
So far so good.
The grass over there looks greener
Over the years, I’ve wondered whether we have a tendency to be more critical of the things that we have near our homes and look at other places through rose-coloured glasses. (Isn’t this the whole basis for tourism?) Or do we tend to value what we have and downplay our interest in attributes we can’t have?
Let’s work through a few survey response scenarios to see whether there might be a relationship between the value (or importance) we ascribe to a liveability attribute and how we’re likely to rate it.
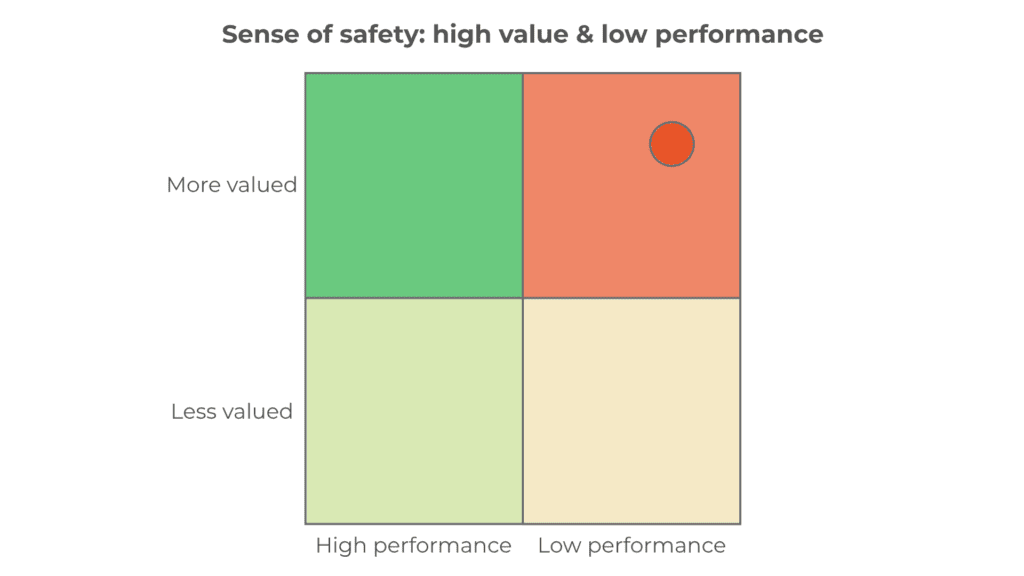
Safety first. If you live in a place where burglaries and property damage are common, you might respond that safety is important to you, and you’d rate your neighbourhood safety poorly. So in this case, you’re placing a high importance on something you’re lacking. Conversely, if you live somewhere safe, safety might not be a priority for you.
How about parking? If you live in an apartment within walking distance to work and amenities, you might respond that ease of driving and parking is neither particularly important nor particularly problematic. If you live in a regional town where there is no public transport but plenty of space to park, your circumstances are quite different, but your responses could be similar.

In this case, you’re placing a low importance on something you don’t use. But if you need to drive for work, and the roads aren’t clear, you might be a little put out. We see this same pattern with childcare services, which peak in importance in responses from young families only.
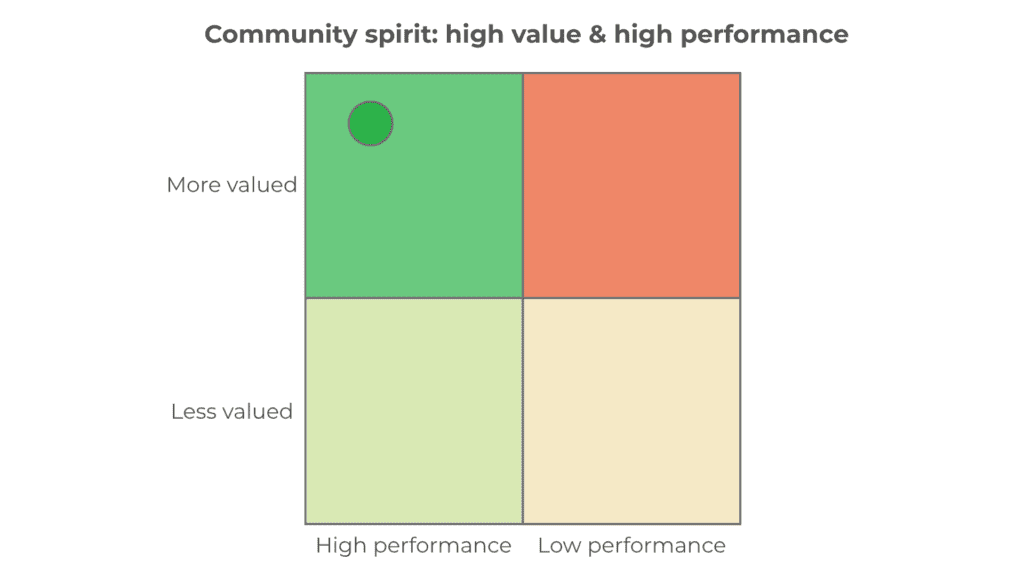
What if you’ve lived in one place for years and know all your neighbours? You lend Bob your lawn trimmer, and he gives you fruit from his tree. In this case, you cherish what you have and rate the sense of neighbourly connection highly.
What pattern – if any – emerges from these thought experiments? It doesn’t look as though we can predict whether someone’s going to value an attribute highly just based on their local place experience, since we’re inclined to value attributes whether we have them (friendly neighbours) or not (safety).
So where does that leave us?
Let’s grab our results from 2025 and look at the difference in place experience ratings between people who said an attribute was important to them and those who said it wasn’t important. Thankfully, in our surveys, people can only select 15 of our 50 attributes as being ‘most important’ to them in their ideal neighbourhood. While we might feel that ‘everything is important’, we also know that not everything can be prioritised at the same time; there’s a limit to the public purse.
The following chart shows how our attribute ratings (i.e, our rating for where we live) differ depending on whether we have stated that those same attributes are ‘most important’ to us.
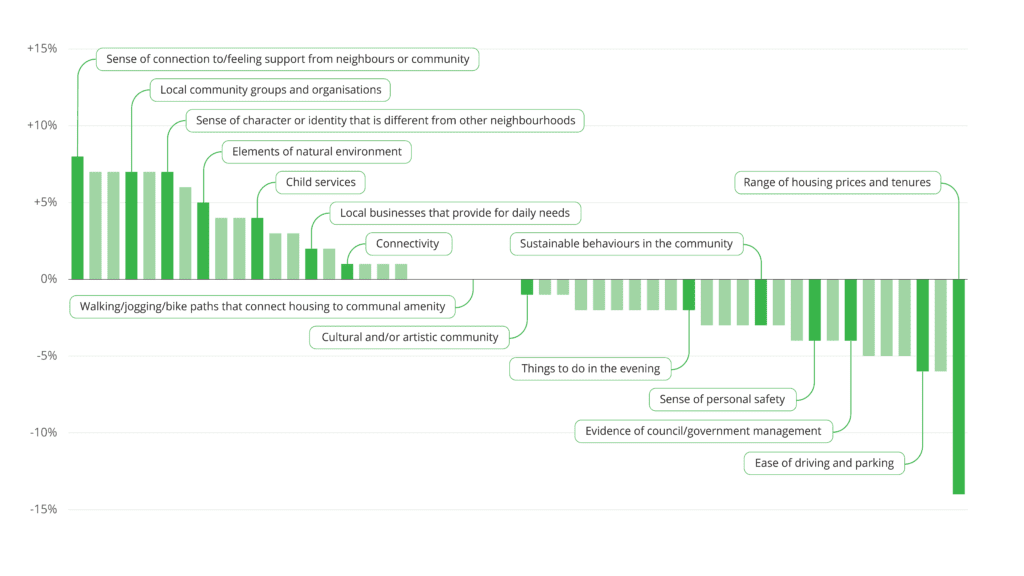
Despite the fact that we’ve only labelled some of the attributes to preserve legibility, there’s quite a lot to unpack here, so let’s go over some of the stories this chart reveals:
- Clustered on the left are the majority of our social liveability attributes. Their position here means that these attributes tend to attract higher ratings from people who consider them important. Perhaps we could call them ‘happy’ attributes for easy reference. People who use childcare services rate them 4% higher than people who don’t use them.
- Conversely, on the right are the ‘unhappy’ attributes which attract lower ratings when respondents consider them important. The standout is affordable housing (Range of housing prices and tenures). When respondents don’t select this as one of their 15 important attributes, the average rating is 5.4 out of 10. When respondents do select this of one of their 15 important attributes, the average rating drops to 4 out of 10. If we are struggling to pay for a home – or we feel unsafe – it’s visceral.
- In the middle are attributes whose average ratings vary little or not at all, whether they are considered important or not. These attributes are less emotive or subjective; let’s label them ‘neutral’. It’s interesting to contrast the very emotive Ease of driving and parking with the neutral Connectivity. Even Things to do in the evening is not particularly ‘unhappy’: we seem to agree how good the local nightlife is, whether we prioritise it or not.
Our progression of attributes from right to left is analogous to the bottom-up reading of Maslow’s hierarchy of needs. As we feel safer and more capable, we trust and build bonds with our neighbours.
So what’s going to happen next?
At any point in time, we have a number of options open to us. We cannot continually postpone decision-making, although admittedly, group decisions are not straightforward.
Armed with the above insights, we have a balanced way to assess and interpret community sentiment to help us build better public places in Australia, before we get too close to the brink. In a few years’ time, we’ll be able to look back and see how far we have come.
To explore more insights from our 2025 Australian Liveability Census: