
Author: Yanting Zhan, Partnerships Manager, Place Score
Across Australia, communities are becoming increasingly mobile. Nearly 40% of Australians change address within a five-year period, meaning people are more willing than ever to move in search of better opportunities, services and quality of life.1
In this environment, liveability plays a critical role in whether people choose to stay in a place or move elsewhere. When neighbourhoods provide safe streets, accessible services, welcoming communities and strong local opportunities, people are more likely to remain and invest their lives there. When these conditions weaken, communities face growing challenges in retaining residents and attracting new ones.
At the same time, liveability across Australia is showing signs of decline. With national liveability data now available for 2019, 2021, 2023 and 2025, we can begin to clearly track how neighbourhood liveability is changing over time. On average, liveability scores across Australia have gradually declined. This trend is not limited to one state or one type of community. It reflects a range of pressures affecting communities nationwide – rising living costs, housing stress, infrastructure strain, climate impacts, social fragmentation and economic uncertainty.
The combination of increasing mobility and declining liveability creates a growing challenge for many communities. As people become more mobile, places experiencing declining liveability may find it increasingly difficult to retain residents and maintain community stability.
Yet the national trend does not tell the whole story. A closer look at the data reveals an important pattern: while many communities are experiencing declining liveability, others have maintained stable performance, and a small number have even improved. Understanding these places becomes more important than ever.
The objective of this paper is to explore how liveability is changing across Australia and examine what we can learn from the councils that have managed to sustain or improve liveability despite broader national pressures. By analysing trends in the Australian Liveability Census, this article highlights patterns of resilience and identifies the shared characteristics of communities that are performing strongly.
Liveability reflects how people experience everyday life in their neighbourhoods – from access to services and public spaces to safety, connection and opportunity. When liveability improves, it strengthens the relationship between people and place and builds the foundations for communities that can adapt and thrive over time.
THE AUSTRALIAN LIVEABILITY CENSUS
In the 2025 Census, more than 25,000 residents rated 50 attributes of neighbourhood liveability, reflecting how each one affects their day-to-day lives, covering areas such as safety, access to services, public spaces, mobility, community connection and local economic activity. In total, over 1.25 million individual ratings were recorded.
To ensure meaningful comparison, this analysis focuses on Local Government Areas (LGAs) and Districts with statistically valid sample sizes (n>=40), examining how liveability is changing over time, identifying where improvement is occurring and how.
1. Four key findings from the data
The 2025 Australian Liveability Census results led to a national average PX score of 66/100 in 2025, down from 67 in 2023 and 68 in 2021. The overall trend is clear: liveability across Australia is gradually declining.
Looking deeper, this decline is not limited to one state or one type of community. Most states and territories have seen liveability scores fall over time, although a few places are performing against the trend. Tasmania stands out as the only state where liveability has remained stable between 2023 and 2025, and has slightly improved (+1) since 2021.
The pattern also varies across demographic groups. Across most states, female liveability ratings have declined, remaining stable only in Tasmania, the ACT and the Northern Territory. In Tasmania, female PX scores have increased by +2 since 2021. Male scores have also improved slightly in Western Australia and Tasmania.
Age tells another story. The older the age group, the less likely liveability scores are to have improved over time. Youth scores increased slightly in Western Australia, the ACT and Tasmania between 2023 and 2025, while none of the over-65 age groups across the states recorded an increase.
These patterns likely reflect the broader pressures many communities are facing, such as rising living costs, housing affordability challenges, infrastructure strain and economic uncertainty.
In simple terms, the data reflects what many Australians are already feeling in their everyday lives.
2. Not all LGAs/districts are experiencing a decline
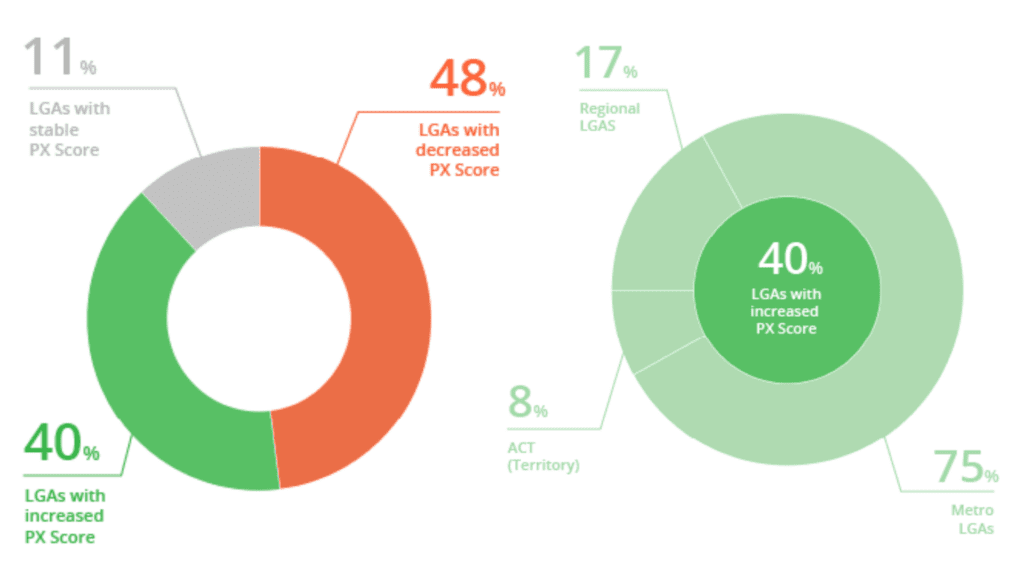
While nationally and at the state and territory level, liveability is declining or in the case of Tasmania, staying stable, the communities of 40% of reportable LGAs have rated liveability higher than in 2023. ACT, NSW and NT have the highest share of improving LGAs/districts, with more than half showing increased performance between 2023 and 2025.
| STATE | n = no. LGAs/districts | % of LGAs/districts with increased performance | % of LGAs/districts with stable performances | % of LGAs/districts with decreased performances |
|---|---|---|---|---|
| Australia | 89 | 40% | 11% | 48% |
| ACT | 4 | 75% | 0% | 25% |
| NSW | 40 | 58% | 10% | 33% |
| NT | 2 | 50% | 50% | 0% |
| QLD | 6 | 0% | 0% | 100% |
| SA | 7 | 14% | 0% | 86% |
| TAS | 3 | 33% | 0% | 67% |
| VIC | 18 | 22% | 6% | 72% |
| WA | 6 | 33% | 67% | 0% |
Table 1. LGAs across Australia and by state showing an increase, stability, or decrease in PX Score between 2023 and 2025, with valid sample sizes (n ≥ 40).
3. The metro-regional divide is evident
Of the LGAs that improved, 75% are metropolitan councils, while only 17% are located in a regional area.
This does not mean regional communities cannot improve, but it suggests that maintaining or improving liveability may be more difficult in regional contexts. Regional councils often face additional challenges, including smaller populations, tighter budgets, limited infrastructure investment and fewer local services.
These structural constraints can make it harder to maintain the same pace of improvement seen in larger metropolitan areas.
4. The decline is sharper than improvement
There is also a clear difference in scale between gains and losses. Improvements ranged from +1 to +7 (Table 2), while declines ranged from -1 to -9.
In other words, when liveability drops, it tends to fall further and faster than it rises. The downside gap is larger. This makes the councils that have managed to retain or improve their performance even more important to learn from, because sustaining progress in this environment is far from easy.
WHICH ARE THE MOST STABLE AND IMPROVED LGAS?
When we looked at the LGAs with the largest increases, one thing stood out – they are geographically diverse. Top performers appear across most states (except for Queensland), showing that resilience is not limited to one policy setting or economic environment. Across Australia, councils are demonstrating different pathways to improvement, offering valuable benchmarks and lessons that others can learn from.
To understand what is driving this resilience, we examined the top 15 most improved councils and looked at their shared characteristics.
| STATE | LGAs/districts | Metropolitan/Regional | PX Score 2023 | PX Score 2025 | Score Difference |
|---|---|---|---|---|---|
| NSW | Liverpool (C) | Metro | 54 | 61 | +7 |
| SA | Marion (C) | Metro | 64 | 71 | +7 |
| NSW | Camden (A) | Metro | 69 | 74 | +5 |
| NSW | Georges River (A) | Metro | 65 | 69 | +4 |
| NT | Darwin (C) | Metro | 64 | 68 | +4 |
| WA | Joondalup (C) | Metro | 70 | 74 | +4 |
| ACT | Canberra Central | 72 | 75 | +3 | |
| NSW | Inner West (A) | Metro | 73 | 76 | +3 |
| NSW | Strathfield (A) | Metro | 66 | 69 | +3 |
| NSW | Parkes (A) | Regional | 60 | 63 | +3 |
| NSW | Canterbury -Bankstown (A) | Metro | 60 | 63 | +3 |
| NSW | Wingecarribee (A) | Metro | 68 | 71 | +3 |
| TAS | Hobart (C) | Metro | 72 | 75 | +3 |
| WA | Busselton (C) | Regional | 70 | 73 | +3 |
| NSW | Northern Beaches (A) | Metro | 70 | 72 | +2 |
Table 2. Top 15 most improved Local Government Areas (2023–2025), with valid sample sizes (n ≥ 40).
WHAT DO THE TOP PERFORMERS HAVE IN COMMON?
While every place is unique, the data shows clear patterns.
Strong social connection
Many of the improving LGAs scored highly on metrics linked to belonging and community identity, including:
- Welcoming to all people
- There are people like me (age, gender, interests, ethnic backgrounds, etc.)
- Connectivity (proximity to neighbourhoods, jobs, shops, and services)
These results suggest that social inclusion and community connection play an important role in liveability resilience. When people feel welcomed, represented and connected to opportunities, their perception of neighbourhood liveability improves.
Balanced everyday infrastructure
Improving councils also showed consistent strengths in everyday neighbourhood infrastructure, including:
- Local business providing daily needs
- Well-maintained public open spaces
- Access to neighbourhood amenities such as cafés, shops and health services
- Safe walking, cycling and public transport options
- Natural environment features such as vegetation and waterways
Together, these elements create neighbourhoods where daily life feels convenient, accessible and enjoyable.
Importantly, these councils are not excelling in just one area. Instead, they are performing consistently across multiple aspects of neighbourhood life.
WHAT RESILIENCE LOOKS LIKE IN PRACTICE?
While every community is different, a clear theme emerges from the data: resilience comes from balance.
The most resilient councils are not relying on a single strength, such as economic growth or environmental quality. Instead, they are building balanced neighbourhood systems that support everyday life. Accessible services, strong local businesses, safe mobility, quality public spaces and inclusive communities all work together.
This balance creates a buffer. When broader pressures arise, whether economic, environmental or social places with multiple strengths are better able to absorb those shocks.
Interestingly, the small number of regional councils that have maintained or improved liveability do not necessarily share the same top-performing metrics or strengths. Regional places are highly diverse, and their pathways to resilience look very different. What they do share, however, is consistency in measuring liveability over time and maintaining ongoing dialogue with their communities. In regional contexts where resources are tighter and conditions can change quickly, this commitment to consistent measurement and engagement becomes an important foundation of resilience.
THE ROLE OF COMMUNITY DATA IN BUILDING RESILIENCE
Sustaining liveability is not easy. Communities evolve, needs shift and local governments must often work within tight financial constraints.
But the data shows that councils that embed community insights into their decision-making are better positioned to respond to these changes.
When councils regularly measure liveability and listen to community voices, they gain a clearer understanding of what matters most to residents, and where investments can make the greatest difference.
This approach turns community data into practical guidance for long-term planning.
Looking ahead
The real question is not simply “Which councils are performing best today?” A more useful question is: “What foundations are we strengthening so our communities remain liveable in the future?”
Resilience in liveability is built over time. It comes from consistent investment in the everyday elements that shape how people experience their neighbourhoods. By focusing on balanced development, inclusive communities and evidence-based decision-making, councils can strengthen the foundations that allow communities to adapt and thrive – even in times of uncertainty.
- Australian Bureau of Statistics. (2018). Census of Population and Housing: Reflecting Australia – Stories from the Census, 2016. Population Shift: Understanding Internal Migration in Australia. ABS. ↩︎
To explore more insights from our 2025 Australian Liveability Census: