
Author: Chris Jensen, Urban and regional planner, City of Townsville
“Townsville City Council has been tracking liveability insights since 2019. In that time, we have used the data to guide and monitor overarching strategic directions while also concentrating on topics important to the community.”
Chris Jensen, Urban and regional planner, City of Townsville
Which place attributes perform well in safer neighbourhoods? Are these attributes contributing to the perception of safety?
According to the 2025 Australian Liveability, having a Sense of neighbourhood safety (from crime, traffic, pollution, etc.) is ranked the 5th most important factor of an ideal neighbourhood. The relative importance of safety for communities is expected, as safety is a basic human need. Our analysis shows that Liveability Census participants have a perception of neighbourhood safety that is intertwined with the condition of the places and communities to which they belong. Therefore, improving neighbourhood safety must be a priority for all levels of government and all community members.
This paper explores the performance of one of Place Score’s Attributes, Sense of neighbourhood safety (from crime, traffic, pollution, etc.), to determine the connection it has with other place attributes to understand whether the perception of safety is a gatekeeper of positive place experience, and whether other place attributes can influence safety, presenting opportunities for action. What clearly emerges is that over half of the Place Score’s Place Attributes show moderate to strong correlation with Sense of neighbourhood safety, indicating the many Place Attributes associated with feeling safe.
Methodology
Place Score runs the Australian Liveability Census every two years (2021, 2023, 2025, etc.) with an objective to obtain proportional participation across metro and regional areas, states and territories, and age and gender groups. In 2025, 27,229 people participated by selecting the 15 out of 50 Place Attributes that are most important to them in their ideal neighbourhood, then rating the 50 attributes in the suburb where they live. Place Score, having collected such a large dataset over our sparse country have given access to understanding human experience of place through statistical analysis.
In this paper, the Place Experience (PX) of the 50 Place Attributes has been analysed across 76 Australian suburbs1. The dataset was used to analyse the spatial variation of all 50 Place Attributes and determine whether the experience of Sense of neighbourhood safety correlated with the experience of any other attribute to suggest a list of determinants of safety.
Of the 50 Place Attributes, three mention “safety” and are designed to capture different elements of safety where there are bound to be different interpretations amongst respondents.
- Access and safety of walking, cycling and/or public transport (signage, paths, lighting, etc.) relates to the functional safety of transport infrastructure.
- Sense of personal safety (for all ages, genders, day or night) relates to the influence other people have on feeling safe.
- Sense of neighbourhood safety(from crime, traffic, pollution, etc.) relates to the influence the environment has on feeling safe. As the data is derived from a community survey, the PX of these attributes provides a measure of the perception of safety.
Briefly on neighbourhood safety discourse
There is much theory and guidance available on creating safe neighbourhoods. Crime Prevention Through Environmental Design (CPTED) guides are produced by different state government police services. Many topic-focused publications, like Exploring the Ways Arts and Culture Intersect with Public Safety (Ross, 2016), and Creating Safe and Inclusive Public Spaces for Women (Women’s Health East, 2020), can be found to focus interventions. Research from the Scanlon Foundation Research Institute also offers insight into the relationship between community cohesion and our experience of neighbourhoods. The Mapping Social Cohesion 2025 report notes connections between feelings of trust in others and the perception of social cohesion in neighbourhoods and also observes the positive influence neighbourhood cohesion has on happiness in their survey of more than 8,000 Australians (O’Donnell, 2025). Other research also supports community engagement to identify the neighbourhood safety issues, for example, Ziersch et al’s (2023) interviews with young people of refugee backgrounds imply that community members can identify the elements of the urban environment influencing their feeling of safety.
Despite the research and resources available, policies often look to increase police powers or implement tougher penalties. For example, the “adult crimes, adult time” campaign used by the Liberal National Party helped gain voter support in the 2024 Queensland State Government Elections. The Liveability Census 2025 provides a refreshing confirmation that addressing community safety concerns is more than just a matter for police services. The design and management of public and private places and social belonging and connection matter if we want communities to feel safe in the places where they live.
Spatial Variation and Correlation Analysis of Place Attributes
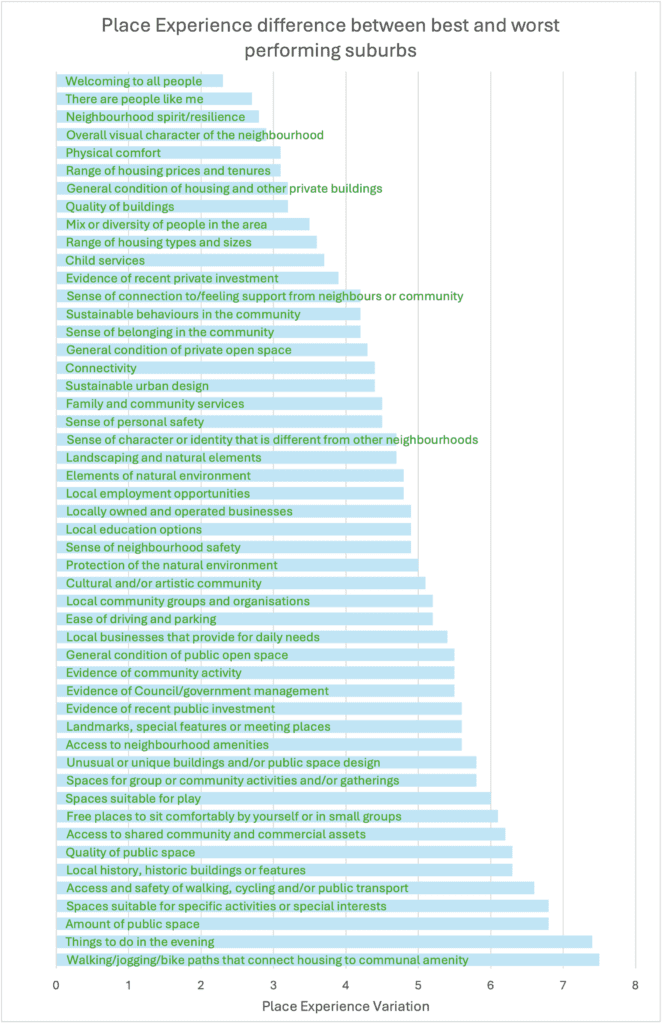
Spatial variation refers to how something changes or varies across different locations. The spatial variation of Place Attribute performance is observed across all 50 attributes, with Welcoming to all people showing the least variation and Walking/jogging/bike paths that connect housing to communal amenity showing the most variation across the suburbs.
In the suburbs analysed the PX scores for Sense of neighbourhood safety range from 3.7/10 (Gatton, a suburb in rural Queensland) to 8.6/10 (Newington, a suburb in Western Sydney), indicating significant spatial variation.
Observing the spatial variation of two Place Attributes helps identify potential connections or correlations between them. For example, there is a strong correlation between Sense of neighbourhood safety and Sense of personal safety across the suburbs analysed. Where an area has a high PX score for Sense of neighbourhood safety, the area also has a high PX score for Sense of personal safety. On average, the difference between Sense of personal safety and Sense of neighbourhood safety is PX 0.5. Kensington Grove, a suburb in South-east Queensland, had the largest difference between Sense of personal safety (PX 6.5) and Sense of neighbourhood safety (PX 5.1), with a performance gap of 1.4. To explore potential relationships further, the correlations between Sense of neighbourhood safety scores and the other place attributes were examined.
Correlation analysis was used to identify whether a correlation exists and its size and direction, by calculating the correlation coefficient2 between Place Attributes. The correlation coefficient of Sense of neighbourhood safety and Sense of personal safety (r = 0.96) indicates a strong direct correlation between Place Attributes of the selected suburbs, and is the strongest correlation observed in the dataset. The least evident correlation exists between Ease of driving and parking and Local businesses that provide for daily needs, with a correlation coefficient of zero, which might be useful to shift the focus on parking as a cause of local economic decline.
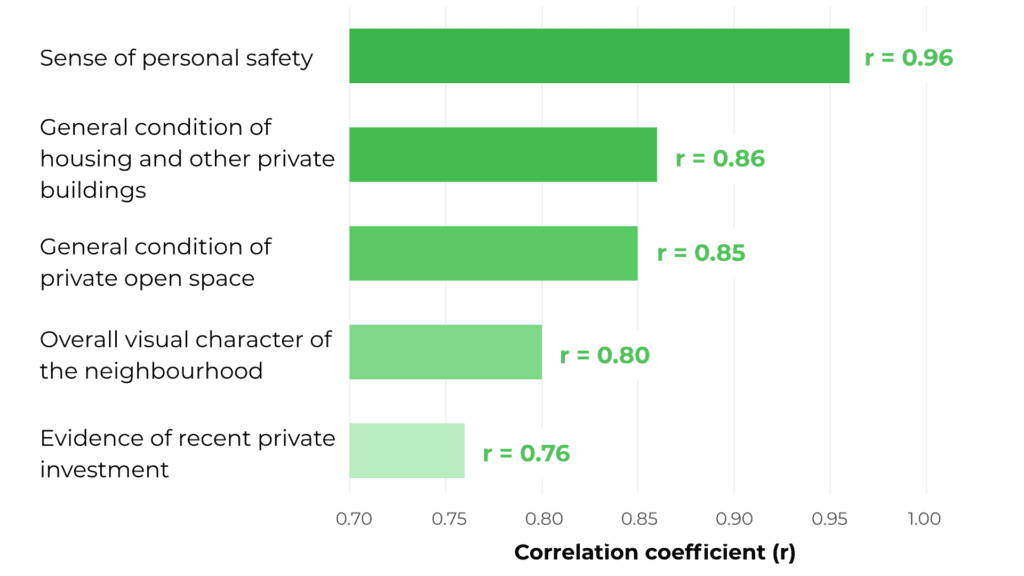
The table below shows the most strongly correlated attributes to Sense of neighbourhood safety and the correlation coefficient. Some of these correlations can be explained because they measure similar constructs (for example, personal safety and neighbourhood safety may be interpreted by respondents as very similar things), or because of structural disadvantages in our neighbourhoods (for example, private investment). Some correlations arise because these attributes are experienced together in everyday life and therefore tend to co-occur.
Click to view the full chart
| Place attribute with the strongest correlation with Sense of neighbourhood safety | Correlation Coefficient (r) |
| Sense of personal safety | 0.96 |
| General condition of housing and other private buildings | 0.86 |
| General condition of private open space | 0.85 |
| Overall visual character of the neighbourhood | 0.80 |
| Evidence of recent private investment | 0.76 |
| General condition of public open space | 0.76 |
| Sustainable urban design | 0.74 |
| Landscaping and natural elements | 0.73 |
| Protection of the natural environment | 0.73 |
| Welcoming to all people | 0.70 |
| Spaces suitable for play | 0.70 |
| Quality of public space | 0.70 |
| Elements of natural environment | 0.69 |
| Sense of character or identity that is different from other neighbourhoods | 0.69 |
| Evidence of recent public investment | 0.68 |
| Neighbourhood spirit/resilience | 0.67 |
| Sense of belonging in the community | 0.67 |
| Access and safety of walking, cycling and/or public transport | 0.67 |
| Evidence of Council/government management | 0.67 |
| Sense of connection to/feeling support from neighbours or community | 0.65 |
| Sustainable behaviours in the community | 0.65 |
| Physical comfort | 0.64 |
| Quality of buildings | 0.64 |
| Amount of public space | 0.63 |
| Free places to sit comfortably by yourself or in small groups | 0.62 |
| Spaces for group or community activities and/or gatherings | 0.61 |
| Spaces suitable for specific activities or special interests | 0.60 |
| Access to neighbourhood amenities | 0.60 |
| There are people like me | 0.60 |
Correlation analysis helps to identify patterns between the performance of place attributes. Understanding the connection between Place Attributes may present new ways to improve our neighbourhoods. Twenty-nine of the 50 Place Attributes indicate a moderate to strong correlation to Sense of neighbourhood safety, which indicates that our experience of place and our perception of safety are intertwined.
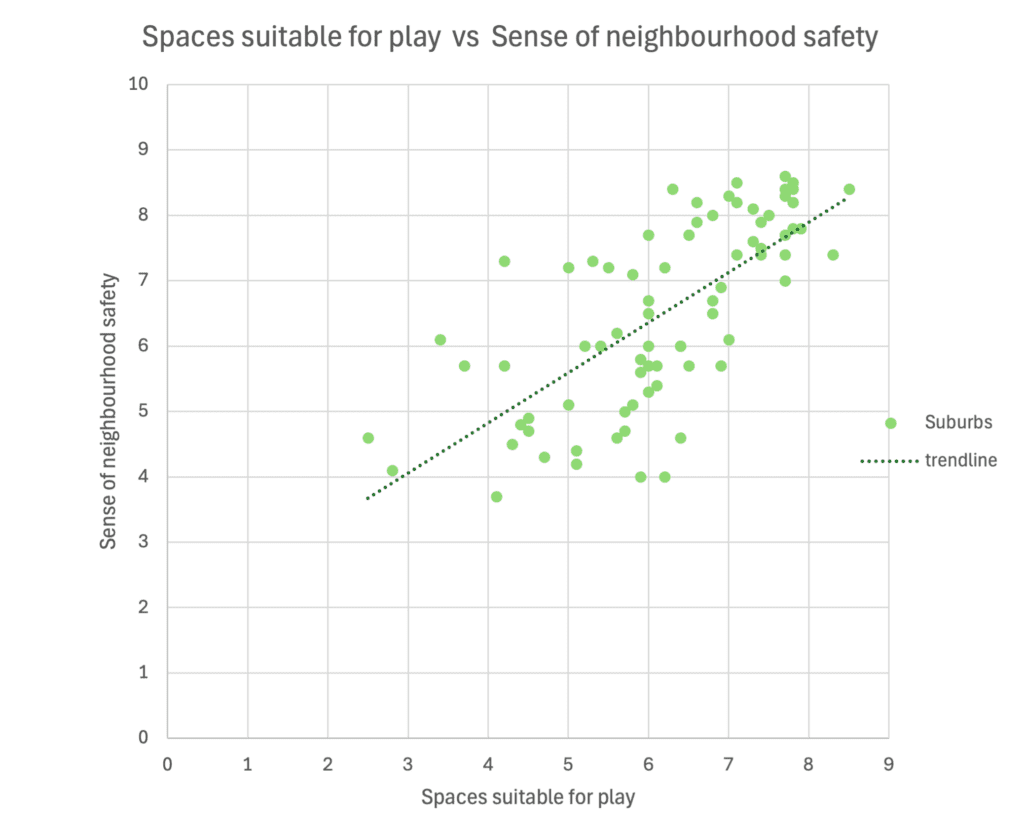
Scatterplots can be used to visualise a correlation. A pattern is evident where two variables have a relationship. A correlation between Sense of neighbourhood safety and Spaces suitable for play is evident when a suburb’s PX score for both attributes is plotted. Each suburb falls closely near the trendline, indicating a correlation.
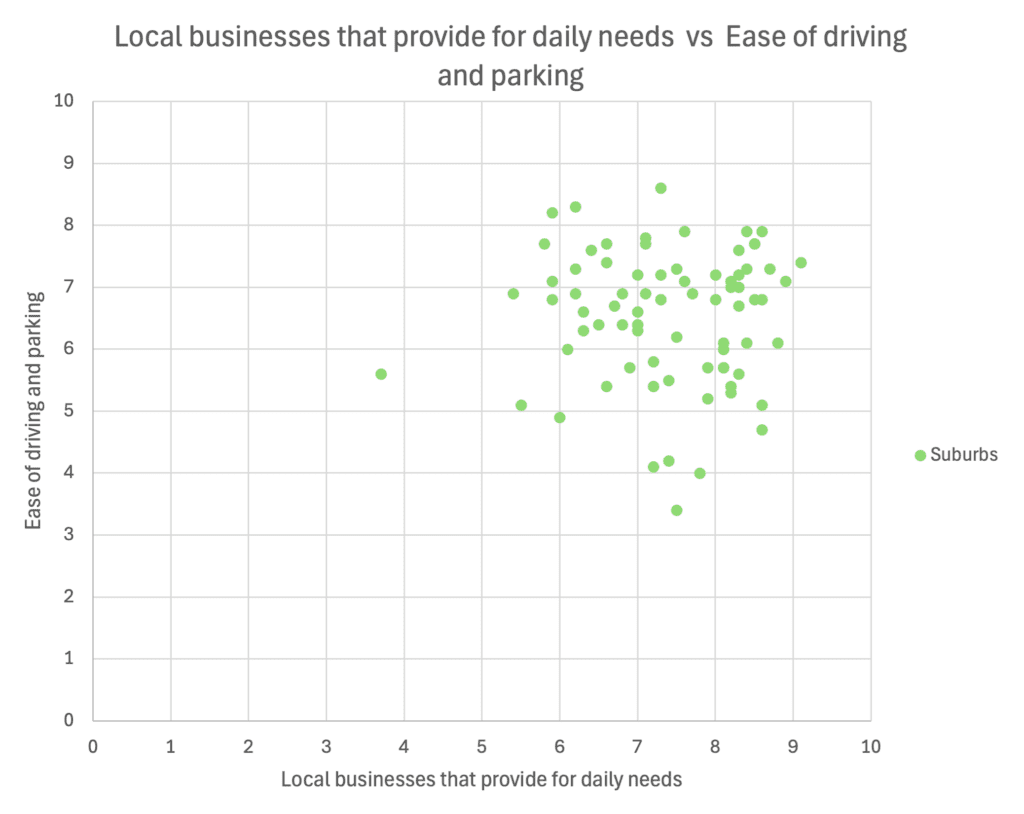
When there is no correlation, suburbs fall in a sparse cluster, as is observed when plotting suburbs’ PX Scores for Ease of driving and parking, and Local businesses that provide for daily needs.
Click to view full Place Experience Variation Charts
Determining action to influence safety
Determining actions to improve the perception of safety would be strengthened by correlation analysis with place attributes and other spatial data sets to identify other underlying characteristics affecting place experience. For example, if neighbourhood safety were a consequence of policing alone, suburbs with a high proportion of protective services workers should also show a higher PX of Sense of neighbourhood safety. Our initial exploration of Australian Bureau of Statistics (ABS) data, undertaken in the background of this paper, identified that socio-economic disadvantage is a strong predictor of Sense of neighbourhood safety by observing correlations with the Index of Relative Socio-Economic Disadvantage IRSD, one of the four Socio-Economic Indexes for Area prepared by the ABS using the 2021 Census. The correlation between IRSD and Sense of neighbourhood safety is strong (r = 0.75). The analysis also used IRSD control for socio-economic variation between suburbs to see which place attributes remain strong predictors of Sense of neighbourhood safety after accounting for IRSD. Even among suburbs with similar disadvantage levels, the ones that respondents felt were safer are those that looked cared-for, had a high-quality public realm and scored better on inclusion and cohesion metrics.
The 2025 Liveability Census has provided a rich dataset for interrogating the intricacies of our neighbourhoods. The analysis does confirm that neighbourhoods which feel safe are also cared for in both public and private places, they have quality open space which incorporates nature, and they allow for human interactions which build connection, belonging and resilience. These correlations point towards returning to the tools of urban design, placemaking and community development to make neighbourhoods feel safer, with three place-based focus areas emerging.
- Improve the condition, maintenance and investment of buildings, open space and environmental areas.
- Design places to be resilient to damage while maintaining function and attractiveness.
– Monitor performance with the quality of public space. - Use regular and reactive maintenance and cleaning to support legitimate uses.
– Monitor performance with Evidence of Council/government management, General condition of public open space and/or Overall visual character of the neighbourhood. - Incorporate natural features and environments into public spaces and ensure they are protected and maintained.
– Monitor performance with Protection of the natural environment and/or Landscaping and natural elements. - Require/incentivise owners and occupiers of buildings to maintain their buildings and private open spaces.
– Monitored performance with Evidence of recent private investment, General condition of housing and private buildings and/or General condition of private open space.
- Design places to be resilient to damage while maintaining function and attractiveness.
- Generate activity and casual surveillance
- Design and manage public spaces and surrounding land uses to encourage people to be in the area, day and night.
– Monitor performance with Access to neighbourhood amenities, Spaces suitable for specific activity and/or Evidence of recent private investment. - Encourage pedestrian movement between places.
– Monitor performance with Access and safety of walking, cycling and/or public transport. - Support legitimate activity to create opportunities for people in public spaces to casually and actively observe activities, reducing any anti-social behaviour occurring.
– Monitor performance with Spaces for group or community activities and/or gatherings, and/or Free places to sit comfortably by yourself or in small groups.
- Design and manage public spaces and surrounding land uses to encourage people to be in the area, day and night.
- Foster social cohesion and community culture
- Encourage community ownership and pride of the community’s public places.
– Monitor performance with Neighbourhood spirit/resilience and/or Sense of connection to/feeling support from neighbours or community. - Design and manage spaces to create social contact, interaction and cultural expression.
– Monitor performance with Sense of belonging in the community. - Recognise the needs of all groups in the neighbourhood. Use equity to remove barriers and create social bridges to strengthen community cohesion.
– Monitor performance with Welcoming to all people.
- Encourage community ownership and pride of the community’s public places.
If we want safer neighbourhoods, we must invest in maintenance, nature, public space quality, community cohesion, and inclusive design. These factors consistently shape how safe people feel, far more than policing presence alone. The analysis suggests that while socio‑economic context shapes overall patterns of perceived safety, the everyday conditions of public and private places, the quality and maintenance of the physical environment, the presence of nature, and the strength of community belonging all play meaningful and actionable roles in how safe people feel in their neighbourhoods. These insights support a broader, place‑based approach to community safety that complements, rather than relies on, traditional policing.
- Suburbs are defined by the geographical boundary ‘Suburb and Locality’ in the Australian Statistical Geography Standard Edition 3 (Australian Bureau of Statistics, 2021). Suburbs and localities were selected each where they had over 40 survey responses. ↩︎
- A Correlation coefficient, signified by ‘r’, is expressed as a number between -1 and 1. A coefficient closer to 1 shows a stronger, direct correlation. A correlation coefficient closer to -1 shows a stronger inverse correlation. A correlation coefficient of around 0 does not show a correlation between variables.
↩︎
To explore more insights from our 2025 Australian Liveability Census:
References
- O’Donnell, J. F. (2025). Mapping Social Cohesion 2025. Scanlon Foundation Research Institute. Retrieved from https://scanloninstitute.org.au/mapping-social-cohesion-2025/
- Ross, C. (2016). Exploring the Ways Arts and Culture Intersect with Public Safety. Urban Institute / ArtPlace America. Retrieved from https://www.urban.org/sites/default/files/publication/79271/2000725-Examining-the-Ways-Arts-and-Culture-Intersect-with-Public-Safety.pdf
- Women’s Health East. (2020). Creating Safe and Inclusive Public Spaces for Women. Retrieved from https://whe.org.au/wp-content/uploads/WHE-Creating-Safe-and-Inclusive-Public-Spaces-for-Women-Report-V2-September-2021.pdf
- Ziersch, A. M. (2023). Health and wellbeing impacts of experiences of public spaces for young people from refugee backgrounds in Australia. Wellbeing, Space and Society, Volume 5. Retrieved from https://www.sciencedirect.com/science/article/pii/S2666558123000519