
From coastal communities teaming with activity to quiet outback towns, Australia is home to all manner of neighbourhoods. At Place Score, we use a comprehensive set of metrics to measure liveability from the perspective of the residents of neighbourhoods across the nation. In addition, since 2023 we’ve been asking our respondents to rate their physical and mental health.
With this data, and in the interest of keeping our country healthy and happy, we wondered what might be the factors that are affecting physical health in our communities. This paper first looks at physical health through the lens of gender, age, ancestry, and household income. Next, we consider geography, interrogating the data with the objective of identifying whether there’s anything about neighbourhoods that directly or indirectly impacts satisfaction with physical health. Lastly, we make recommendations about what might need to change to encourage members of our community to improve their physical health.
Community health and the Australian Liveability Census
Like many regional and remote councils, Parkes faces the same strategic and reporting requirements of larger organisations but with less resources, and the urgent need to attract and retain young talent to the area.
Place Score runs the Australian Liveability Census every two years (2021, 2023, 2025, …). Our objective is to obtain proportional participation across metro and regional areas, states and territories, age and gender. In 2025, 27,231 people participated.
In the 2025 Australian Liveability Census, respondents reported on their own physical health as being Poor, Fair, Good, Very Good or Excellent. The question was optional. We received 20,889 responses, of which 83% reported their physical health as Good or better – these are the Healthy respondents.
The remaining 17% are the Not healthy respondents, i.e. those who reported their physical health as being Poor or Fair. A disclaimer here is that while we have used the terms Healthy and Not healthy, we are not using these terms as health professionals would – rather, we are simply assigning categories to the self-reported scores from the respondents.
Socio-economic impacts on physical health
In our preliminary analysis, we found that socio-economic factors contributing to Not healthy respondents include individuals identifying as neither male nor female, people of Aboriginal heritage, and those from low-income households.
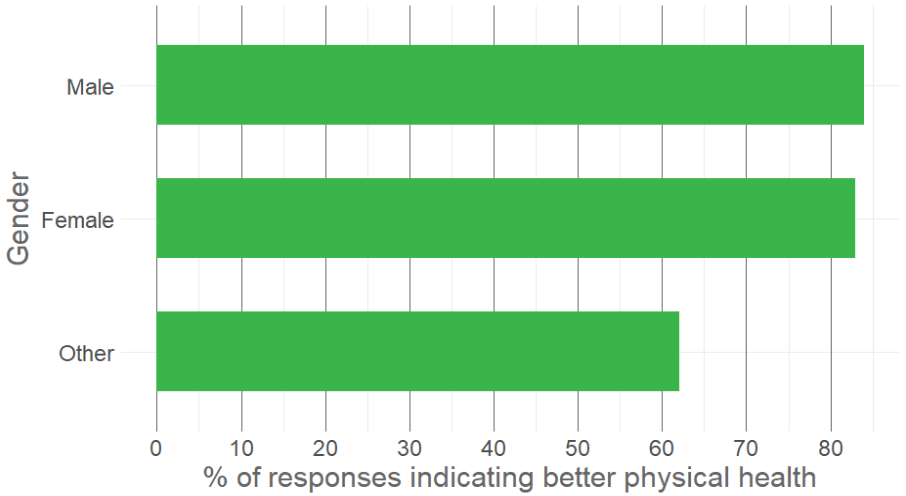
And as seen above, people of “Other” gender (people neither identifying as male nor female) had the lowest proportion of responses indicating good physical health. Men tended to rate themselves as Healthy slightly more than women (84 vs 83).
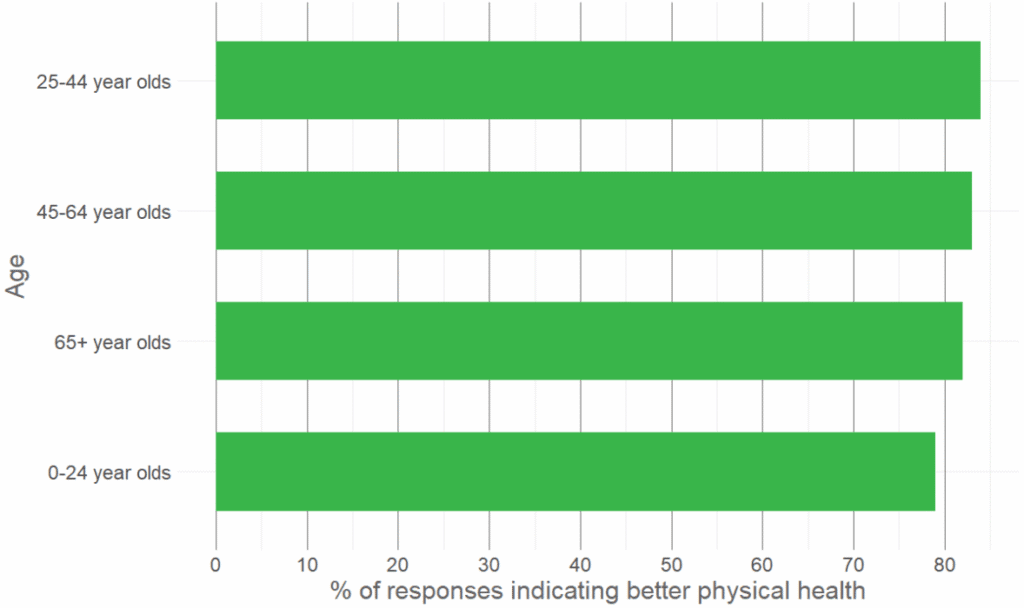
Age was a less significant determinant of physical health. While all age groups are generally satisfied with their health, a smaller proportion of under 24 year olds rated themselves as Healthy.
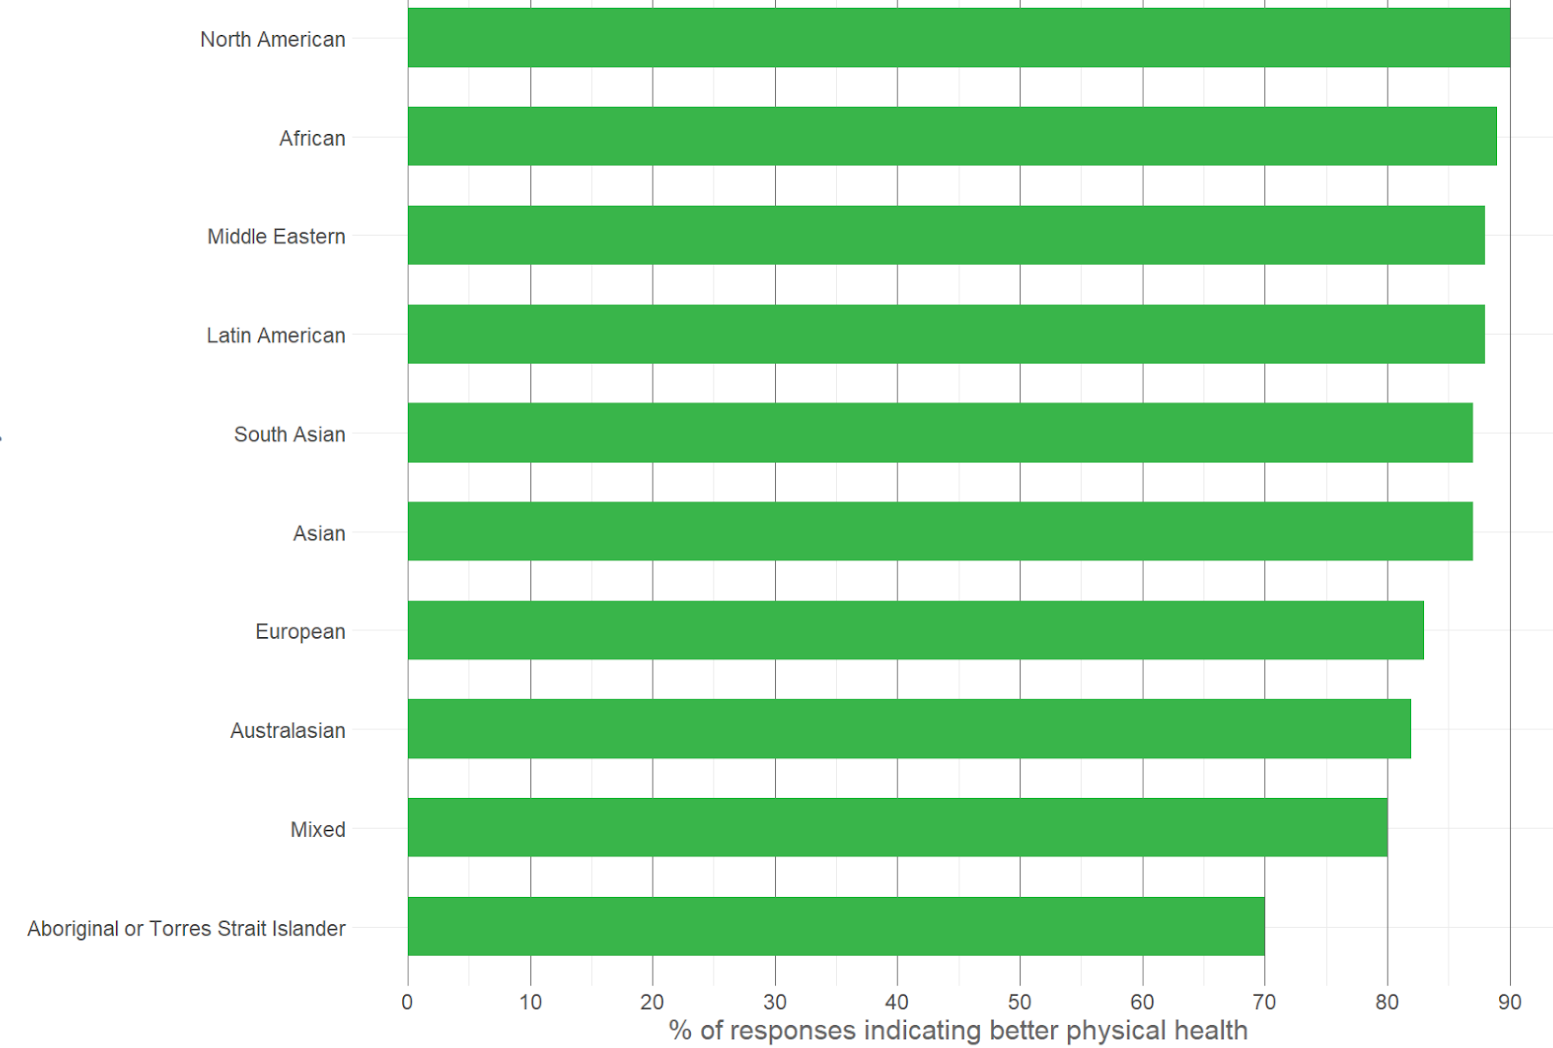
And as seen above, the ancestry with the lowest proportion of respondents satisfied with their physical health with turned out to be Aboriginal or Torres Strait Islanders. People with European and Australasian heritage also had relatively poor self-reported health, while respondents with Asian, American and African heritage were among the most satisfied with their physical health.
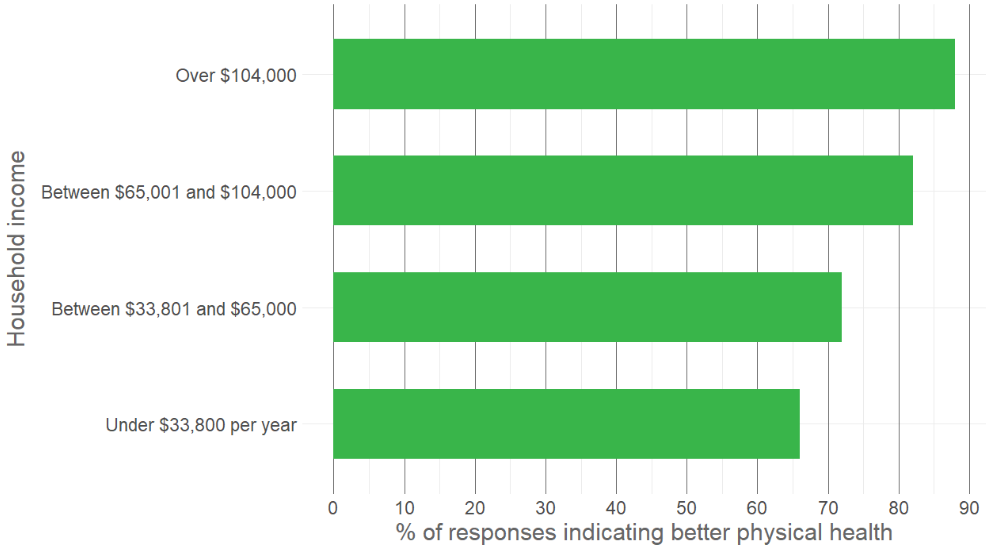
The chart above shows a direct correspondence between household income and self-reported physical health. Higher income households have substantially higher portions of Healthy respondents. The data appears to suggest that people from higher-income families can afford to spend more time and money into their physical health. Perhaps they live in places where it is not just easier to do so, but more integrated into the nature of the place. And that people who are from lower-income families already struggle with basic expenses enough, and consider a gym membership to be a luxury, and a regular walk around the block to be a struggle. We shall try to see if there is any deeper relationship between the income of Australians, the place they live in, and their health in the following section.
Place impacts on physical health
In our subsequent analysis interrogating the geographical aspects of our data, we looked for place attributes that affect how healthy our respondents are. To do this, we sorted the local government areas (whence we received at least 80 responses) from most to least Healthy, and then compared the top ten and bottom 10 Healthy LGAs.
We found that respondents who reported better physical health came from well-developed cities known for their integration with the natural environment, such as around Sydney Harbour, along the Pacific coast and the Parramatta River.
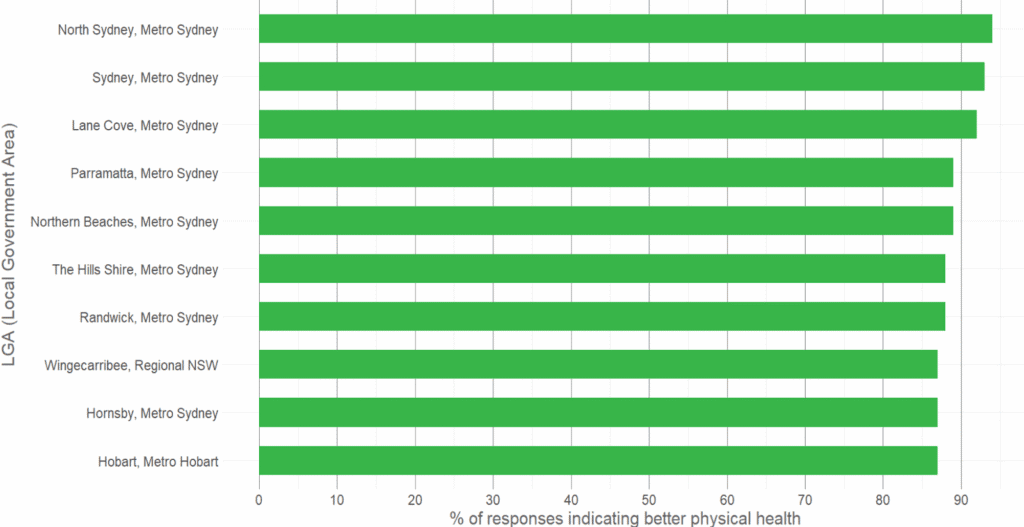
The chart above shows areas like North Sydney, Sydney, Lane Cove and Parramatta, all of which have the unique combination of being significant urban developments as well as having a deep integration with water elements – be it coastal or riverside. Northern Beaches and Randwick also contain many touristy coastal towns with a lot of focus on being outdoors.
These LGA’s have a median annual equivalised total household income between $65,001 and $104,000 weekly according to ABS Atlas, corresponding with the second highest income band shown in the previous section.
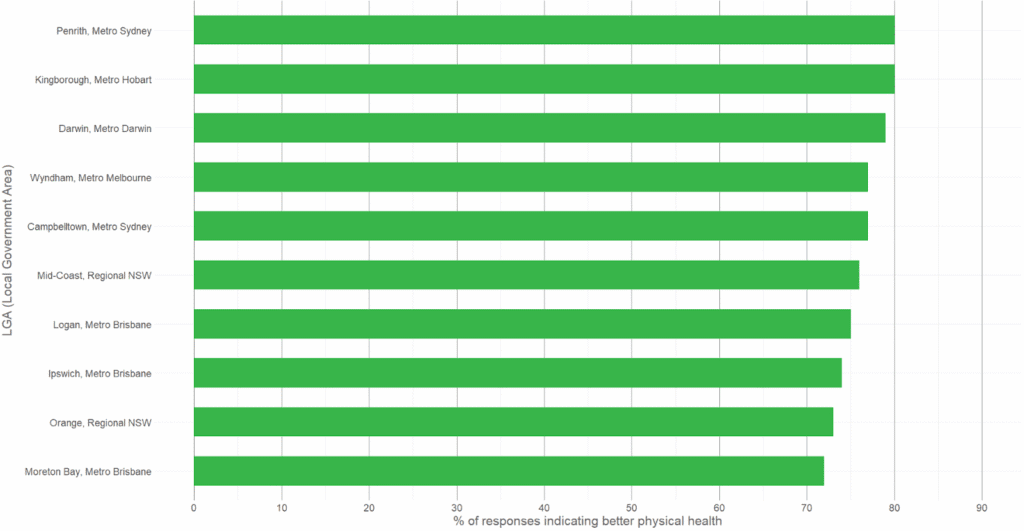
Residents self-reporting better health are less likely to be in the LGAs shown in the chart above. These include Moreton Bay, Orange, Campbelltown, Darwin and Penrith. These happen to also be lower-income LGA’s than the healthier ones, with the median annual equivalised total household income being between $33,801 and $65,000. This does appear to suggest that healthier people tend to live in wealthier areas, and people living in less wealthy areas are not as satisfied with their health.
With the top and bottom performing LGAs by health, we wanted an idea of the place metrics that affect health most. A simple way of doing this would be to compare the attributes of healthy LGAs having the largest difference in score in the non-healthy LGAs. Even though the approach is simple, it gives powerful insights into what healthy neighbourhoods do well that non-healthy neighbourhoods perhaps don’t.
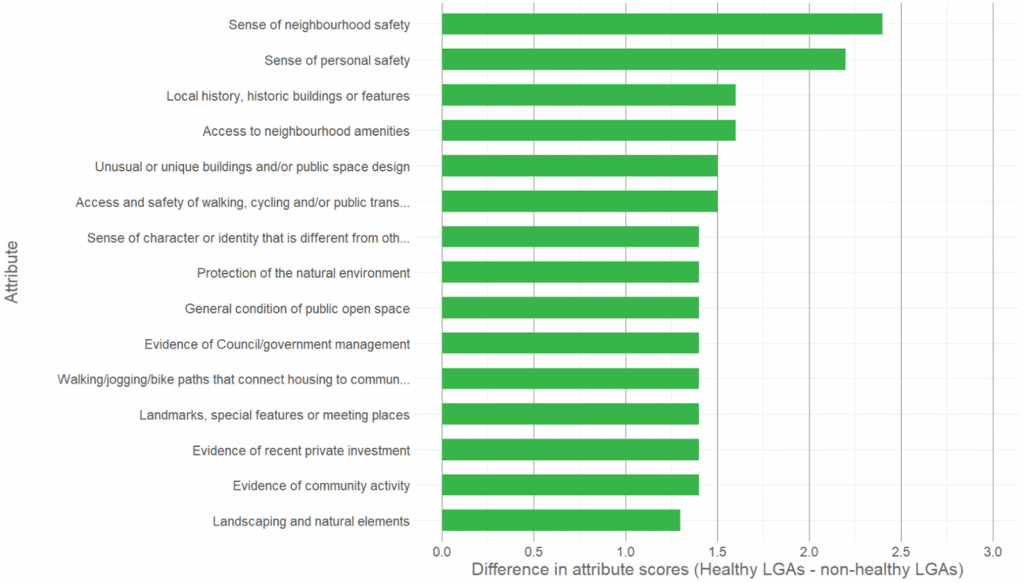
The LGAs with better health have significantly higher scores for attributes around personal and neighbourhood safety. They also have higher scores for metrics measuring both the natural and urban environment around the neighbourhoods. In general, we can gather from this data that safety is what contributes most to neighbourhoods healthy, followed by interesting things to see and do around, and of course infrastructure promoting active transport.
Conclusion
We examined both socio-economic and geographical factors affecting the self-reported physical health of respondents to our survey. Socio-economic factors most strongly associated with health include gender, ancestry and household income. From a geographical perspective, respondents reporting better physical health were concentrated in affluent LGAs with strong natural and urban integration, such as Sydney, North Sydney, and Northern Beaches. These are characterized by waterfront access, greenery, and safe, walkable and interesting environments.To conclude, we recommend that investing in neighbourhood safety, green spaces, neighbourhood connectivity can encourage people to step out more and the character of town centres can encourage people to step out more and encourage them to work on their physical health. While this is not a definitive finding, and we are not health professionals, we have interrogated the data and found these interesting correlations as we want to ultimately help build a healthier, greener and happier community right here in Australia.
To explore more insights from our 2025 Australian Liveability Census: